
Digital Detox Infographic
Role: Graphic Designer
Programs used:
Project Overview
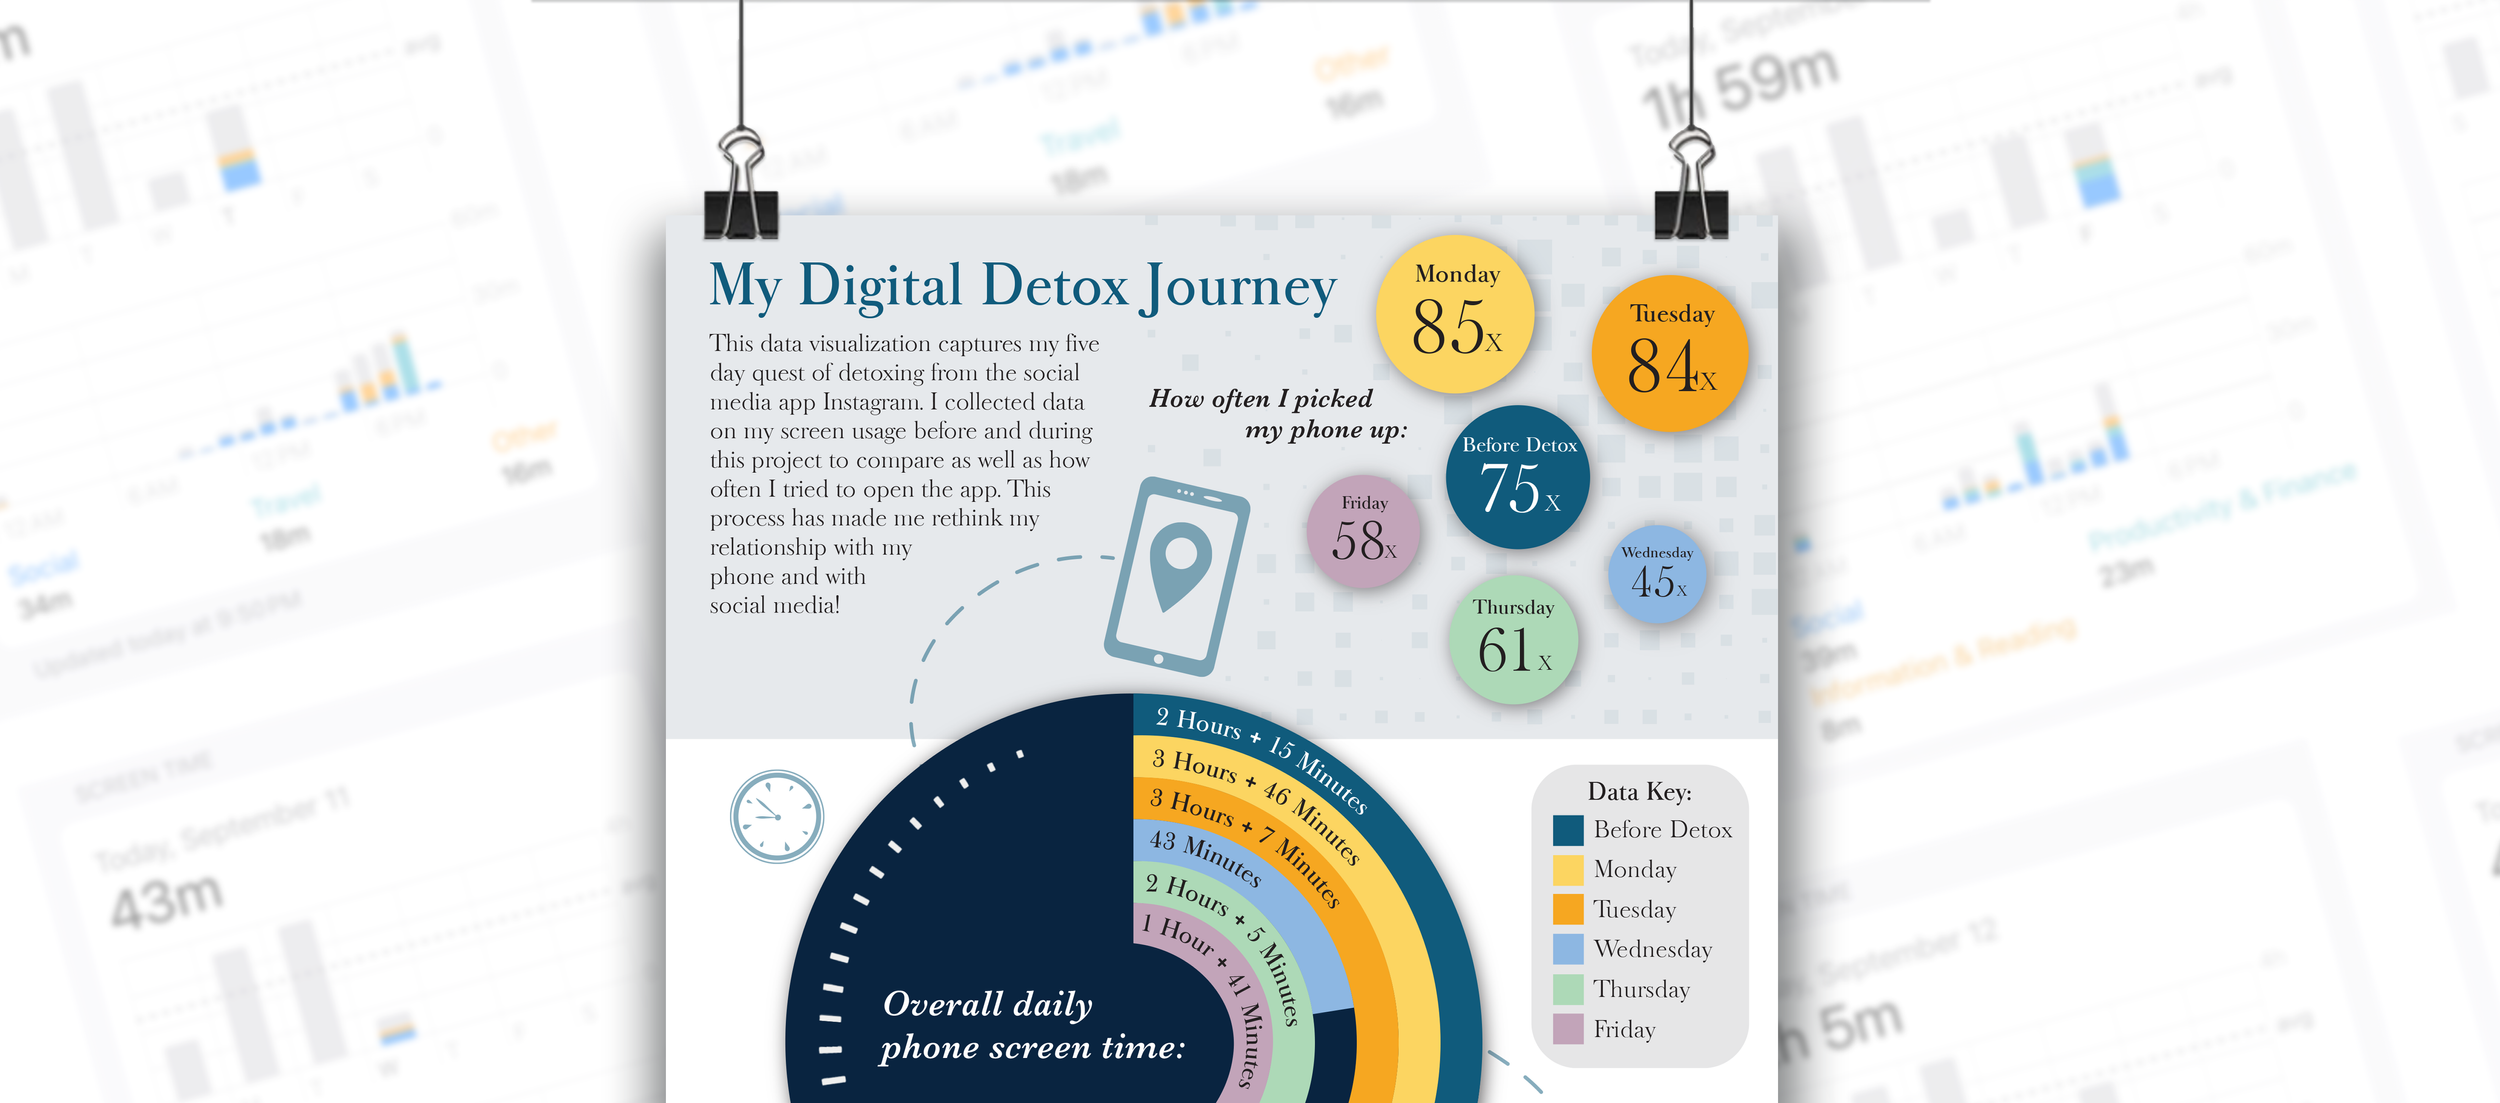
Social media use is increasingly consuming our everyday lives, often without us even realizing how much time we’re losing. This overuse not only distracts us but can also make it harder to focus, ultimately hindering our productivity and ability to stay present.
As a personal challenge, I decided to track myself for five days and not open Instagram, my most used app on my phone. I gathered actual data from my iPhone’s screen time and from the app One Sec. To fight my tech addiction in my own way, after completing the challenge, I created an infographic that I could share and encourage others to do the same. For this data visualization, I took that raw data and created this illustration to better summarize how I did. Experimenting with different chart types, I explored how data influenced key design decisions. Each element was intentionally chosen to support readability and guide the viewer through the information in a logical and impactful way.